

In the previous edition of The SatSure Newsletter, we spoke about the Explainability of Artificial Intelligence. The authors argued that the AI explainability paradigm needs to be overcome before venturing into its ethics. Explainability and interpretability is the concept that humans can understand the predictions made by an AI tool in stark contrast to a ‘blackbox’ model. While interpretability is about how accurate a machine learning model can associate a cause to an effect, explainability talks about how different parameters, often hidden in Deep Nets, justify the results.
This article picks up from the above by assuming that the explainability problem has been tackled. At SatSure, AI is used to create models based on satellite data to calculate the farm credit score for financing. Thanks to the explainable model, we understand how different factors like soil moisture, temperature, and historical cropping patterns influence this prediction. Before employing this model in the real world, we should stop and ask if the model is actually “Fair”.

Fair AI – the Opposite of Biased AI
In a machine learning system, data is used to train a model that provides predictions used to make specific decisions. In any of these steps, if one category is discriminated against another, intentionally or unintentionally, and these predictions reinforce the already existing population bias, the model becomes an unethical AI application. For example, in a given population, we see that women have historically lower wages than men. If a machine learning algorithm learned this data and used it to predict a recruit’s salary and used gender as a parameter, this would be unethical. The distinction should be clear. Truthful reporting of the data does expose systemic discrimination. But when the same bias is utilised for future decision making, this only perpetuates the bias. A fair machine learning algorithm aims to eliminate this vicious loop.
AI Applications Using Satellite Data
Earth observation satellites capture images at high resolution at high frequencies, and AI can transform how data is processed both in space and on Earth. This changes how we can deliver insights to customers. The applications include object detection of elements like buildings, road infrastructure, industrial area, forest land etc. There can also be dynamic detection of land cover changes that can help us monitor agriculture, deforestation, water reserves etc. Many satellite data-based algorithms employ complex AI architectures, which have the scope for biases to creep in either at the detection phase or when it is translated to policymaking.
Biases in Machine Learning Applications of Satellite Image
We can categorise the potential biases of applying machine learning on satellite images into four main areas:
- Radiometric Biases
Satellite image-based remote sensing is highly dependent on the sensor’s specifications, the topology, features of the land, illumination factors, and meteorological conditions both before and during the acquisition of an image. Technical biases could result during the process of generating a remote sensing product. A common challenge faced in this regard is the presence of cloud cover in optical data. Another is the classification of mountainous terrain, which becomes problematic because of variations in the sun illumination angle resulting in biased reflectance data. While these are indeed significant hurdles to overcome and should be considered while modelling satellite data, this analysis is best left to remote sensing technologists and hence not included in this article’s scope.
- Spatial and Geographical Bias
A simple example of this is that a driverless car trained over asphalt roads will fail to navigate grasslands. A quick search on crop classification models using deep learning will take you to a highly Amerocentric and Eurocentric world of datasets and publications1. These models are constantly touted as benchmarks and become global standards for solving machine learning problems on remote sensing data. However, the land-use patterns differ significantly in developing countries where these insights could have the maximum impact. Generating diverse datasets comes at a cost which is currently the most significant obstacle towards solving this problem. A way to address this bias is through the use of suitable open data sets like OpenStreetMap2.
It is not just the datasets that are a victim of this bias. The existing paradigm also influences some of the metrics used to evaluate our hypotheses. For example, there have been studies to assess regional wealth using night light data3, an urban-centric model that will inherently classify an agriculturally thriving community as poor. However, later studies addressed this, and the authors recommended that other metrics like agricultural maps be used in wealth mapping4. This step is the right direction that identifies the source of bias and attempts to mitigate it.
3. Imbalanced Data
Consider a binary classification problem with 99% of data belonging to one class and 1% belonging to the second class, which leads to challenges for the model to learn the characteristics of the minority class and hence difficulties in prediction (Fig a). In one such example in our area of interest, the authors detect oil spills from satellite images5. One of the common methods of mitigating this issue is to up sample the minority data samples or down sample the majority of data samples to create a class balance. But also, one has to be careful in modifying the algorithm and metrics used in testing. For example, classifying all samples in the above mentioned hypothetical dataset as a majority class will give us a 99% accuracy even without any training. This is more of a statistical problem, and Bayesian statisticians have devised numerous methods to identify and tackle it systematically6.
- Reinforcing Biases
We would be discussing this particular bias in detail as it is probably the most dangerous of all biases. Reinforcing bias is central to the example discussed in the introduction paragraph on women employee wages and how that can become a vicious loop. This is illustrated in Fig b, where a real-world bias is propagated in data, modelling and policymaking to further the original bias. As humans, we can see how this is ethically wrong, but machines are not equipped with this “intelligence”. The missing ingredient is causal reasoning which helps us disengage correlation from causation, while for an AI, the relations are purely associative.
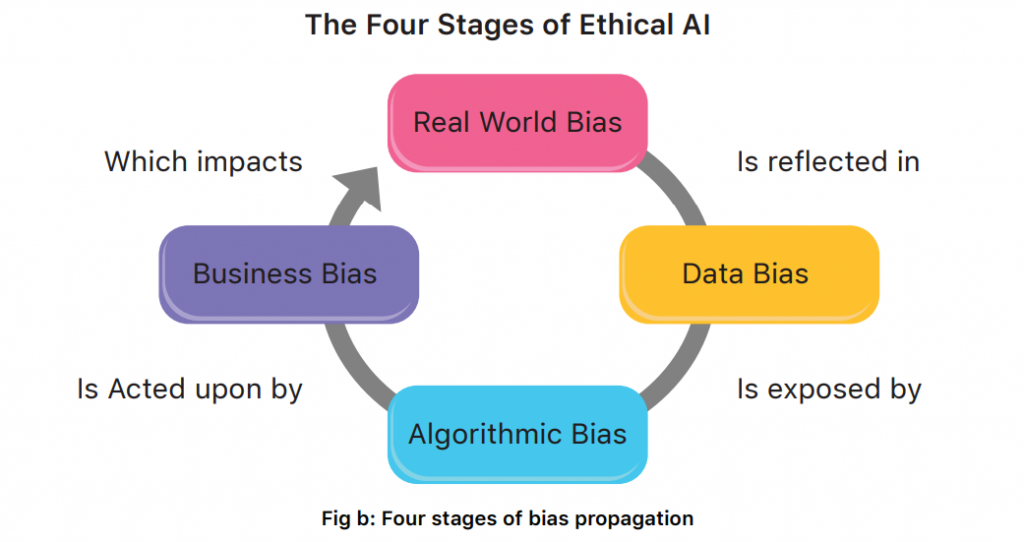
Source: Gartner
Let us go back to our original explainable and interpretable model for farm credit. And let us assume a financial enterprise uses this model to get recommendations on potential areas for investment. We understand how soil moisture contributes to crop performance, and an AI model will recommend that it makes sense to focus our attention and investment on regions with higher soil moisture. However, the model misses in this analysis that soil moisture is heavily a function of rainfall and irrigation facilities. Irrigation facilities, in turn, is a measure of the existing infrastructure facilities and wealth of a region. Thus, we could be investing in an already developed agricultural area, making it even more prosperous while a systemically neglected region would continue to underperform due to lack of attention.
Let’s say we also assume we use the farmers’ profile as a feature in the model. Considering our women’s wage example and knowing that traditionally women have lesser assets and income than men, this will lead to discrimination against women farmers. We see this taking place in countries where female labour is essentially invisible, and in an agricultural family, it is usually the man who is labelled the farmer7. Thus as the biases add up, a woman farming in a historically impoverished region has higher chances of continuing to be poor while a man doing the same job in a rain-fed area is more likely to prosper.
The Responsibility of a Fair AI
The question we have before us on whose shoulders does the responsibility of building and using a Fair AI model lie? One might argue that the onus is on the consumer of the AI product. They would need to take into account the social inequalities and let that not penalise the underprivileged. But what would be the incentive to do so?
Or is the onus on the Data Science or Machine Learning teams handling the data and generating the AI model? But how can a Computer Scientist or Decision Scientist sitting miles away from the regions of interest and has little subject knowledge on the underlying socio-economic patterns know how to account for social biases? It takes a vast amount of experience, both academically and socially, to identify the unintentional consequences. For this reason, it is usually recommended to have a diverse team to work towards a responsible solution.
Going back to the above example of farm credit calculation, if the reviewing team had an urban planner, an economist, an agricultural scientist, and a farmers’ representative to advise the computer scientist, the data modelling would have taken a different approach. A gender-balanced team would have advocated for improving the opportunities for women. Instead of focusing on the peripheral features, the attempt would have been to identify the overarching patterns. In short, in an ideal world, a machine learning model and the team that develops it should represent the ground truth modelled.
References:
1 Shankar, Shreya, et al. “No classification without representation: Assessing geodiversity issues in open data sets for the developing world.preprint : 1711.08536(2017).
2 https://www.openstreetmap.org/#map=4/21.84/82.79
3 Jean, Neal, Rachel Luo, and Jae Hyun Kim. “Nighttime Light Predictions from Satellite Imagery.”
4 Doll, Christopher NH. CIESIN thematic guide to night-time light remote sensing and its applications.”
Center for International Earth Science Information Network of Columbia University, Palisades, NY (2008).
5 Kubat, Miroslav, Robert C. Holte, and Stan Matwin. “Machine learning for the detection of oil spills in
satellite radar images.” Machine learning 30.2 (1998): 195-215.
6 Sun, Yanmin, Andrew KC Wong, and Mohamed S. Kamel.Classification of imbalanced data: A review.”
International journal of pattern recognition and artificial intelligence 23.04 (2009): 687-719.
7 Narayanan, Sudha, and Sharada Srinivasan. No Country for Young Women Farmers: A situation analysis of India. Working Paper, Indira Gandhi Institute of Development
Research, 2020.
Written by Krishna G. Namboothiri, Product Manager – Data Science, SatSure. This article was originally published in The SatSure Newsletter(TSNL)


