Fertiliser Industry in India
India is the 3rd largest producer and consumer of fertilisers. The food production in India increased from 52 million MT in 1951-52 to about 252.22 million MT in 2015-16, and fertilisers had one of the most critical roles to play due to the diversity in soil and agro-climatic conditions of India. The Indian fertiliser market is projected to register a CAGR of 11.9% during the forecast period (2021-2026) as per Mordor Intelligence Report.
Challenges faced by Fertiliser Companies in India
The fertiliser industry in India is largely regulated by the Government of India, with regional sales quotas allocated to fertiliser companies. The challenges faced by fertiliser companies in India are as follows:
Fertiliser sales to farmers are subsidised by the Government. Thus, fertiliser company revenues are directly linked to subsidy payments from the Government. Thus, efficiency in sales and logistics is paramount in achieving revenue targets for fertiliser companies. Underpayments or delays in subsidy payments can impact revenues.
Variation in monsoons, India’s diverse Agro-climatic zones and heavy reliance on manual data collection led to inaccuracies, delays, and bias in planning, resulting in inefficient supply chains and glut and scarcity of Agri inputs.
Intensive agriculture in India has led to soil health problems like nutrient imbalance, depleting soil fertility, deficiencies of secondary and micronutrients, decreasing organic carbon content, and decline in water quality.
Hence, the fertiliser industry faces the additional challenge of acting like promoting organic fertilisers to improve soil health and micronutrient quality and control further soil degradation.
SatSure – Geospatial Analytics-Driven by Earth Observation Satellites
Key questions pertaining to agriculture are:
- What crop is growing?
- Where is the crop growing?
- How fast is sowing progressing?
- How well is the crop growing?
How are crops reacting to environmental risks like drought, inundation, climate change, etc.? SatSure has created a set of modules that cover the entire crop cycle and form the base for solutions for clients.
Satellite-Based Solutions for Fertilizer Companies
Introduction and Background
Soil is a significant source of nutrients needed by plants. Nutrients are essential for soil fertility and stable plant growth. Nitrogen (N), phosphorus (P) and potassium (K), also known as NPK, are the three main nutrients. At the same time, there are many other nutrients, such as calcium, magnesium, sulphur etc., that also play an important role. Plants also need small quantities of iron, manganese, zinc, copper, boron and molybdenum, known as trace elements, because only traces are needed by the plant.
On the agricultural land where farming is a continuous practice, These Nutrients tend to deplete with crop harvest. Hence to maintain the soil nutrients, fertilisers are used. Fertilisers act as a supplement to these nutrients.
Relevance
An excessive or imbalanced application of fertilisers may not only lead to wastage of resources but also contributes to environmental pollution. Studying, modelling, and mapping the spatial distribution of soil properties is an important task for effective farming and sustainable land management. SatSure can contribute to designing a Decision Intelligence framework combining the Remote Sensing and Geographic Information System, which can address such concerns of proper nutrient management at a larger scale. Site-specific nutrient management that takes into account spatial variability of nutrient status can reduce the chances of over-fertilising or under-fertilisation. Supply-demand mapping of Nutrients at the administrative level also helps companies in proper Inventory management.
Methodology
The main objective of the project is to build a decision intelligence model where Soil Nutrient maps can be generated at the administrative or farm level so that stakeholders can make informed decisions.
The activities involve the following:
• Preparing Soil Organic Carbon Map
• Generating NPK report
The steps followed in the mapping of soil organic carbon are as follows: •
SatSure uses the reflectance at 478, 546, and 659 nm for blue, green, and red, respectively, which correspond to the centre wavelengths of the Sentinel-2/ hyperspectral sensor. • Use universal indices for mapping the surface SOC (Thaler et al. 2019; Gitelson et al. 2003; Rodriguez et al. 2006; Sims & Gamon 2002).
• Use 10m/ 30m pixel resolution Sentinel-2/ hyperspectral satellite image. • Within the field, we collect the soil samples to a depth of 15/ 30 cm (Liet al., 2018). The samples are sieved to <2 mm and ground to a powder, and the depth-averaged SOC concentrations for the 15/ 30- cm profile are measured (Li et al., 2018). We use the spectra radiometer, and the field surface spectra are collected.
• The Sentinel-2/ hyperspectral images were acquired for the time when the field was ploughed and lacked both crop residue and crop cover.
• We use the SOCI to predict SOC within the field following the method, i.e., using a subset of the measurements from the field to locally calibrate a relationship between the SOCI and SOC and then use the local calibration to predict measured SOC values.
• SatSure’s soil moisture product is used to know the correlation between both and understand the distribution of surface organic carbon.
• The distribution of surface carbon is checked with respect to slope, aspect, runoff, DEM, soil type, crop type, irrigation etc. and regenerative carbon potential is measured in near real time.
To build the model and achieve accuracy, In situ, data would be required, which consists of • Soil Profile( Soil pH, Soil Nutrients, date of sampling etc.)
• Geo Coordinate the farm
• Crop Type
• Sea Level
This can also be done if we have Archive data consisting of all parameters.
Expertise and operational capacity
The SatSure team has done case studies on Soil Organic carbon. Also, have experience in surface soil organic nitrogen.
Supply Chain Solutions
The supply logistics for the fertiliser industry heavily depends on the crop cycle and crop performance in the areas of interest. Historical and current crop data from satellites provide the granularity needed for improving fertiliser industry operations.
The supply chain for the fertiliser industry in India comprises factories, railheads, warehouses and dealers.
Understanding the time, location and volume of sowing and crop growth stages is of prime importance to the sales and marketing, production and logistics departments of the fertiliser company. Fertiliser companies plan their production, sales and supply chain based on the above data.
The fertiliser business calendar leads to the requirement of two kinds of demand forecasts, namely:
Forward-looking demand forecast
• In-season demand intelligence
The calendar below shows when these forecasts are required with respect to business activities.
SatSure uses multiple datasets for generating forward-looking demand forecasts and in-season demand intelligence. This helps the fertiliser company avoid stock-outs through improved production forecasts and inventory planning which can lead to increased sales.
Forward-Looking Demand Forecast
India’s diversity in geography and climate variations affect agricultural activity, which in turn leads to fluctuations in fertiliser demands. These fluctuations in the market lead to demand-supply gaps for fertiliser companies.
SatSure builds catchment zones for warehouses & dealers (if required) to create demand zones based on crops grown in the region.
Historical analysis of the sowing patterns sowing window co-relations with external factors like weather, prices etc., is used for a demand forecast before the season starts. This long-term forecast assists the sales and marketing team to plan and allocating their sales machinery based on location and timing intelligence. The data also assists in production & inventory planning for an upcoming season.
In Season Demand Intelligence
In-season demand intelligence provides early sowing window predictions, sowing progress monitoring and near real-time monitoring of the crop cycle, thus providing detailed information on how the crop cycle in a particular area is progressing. This helps the sales team identify which areas will have spikes in demand, thus ensuring enough inventory is available in the area.
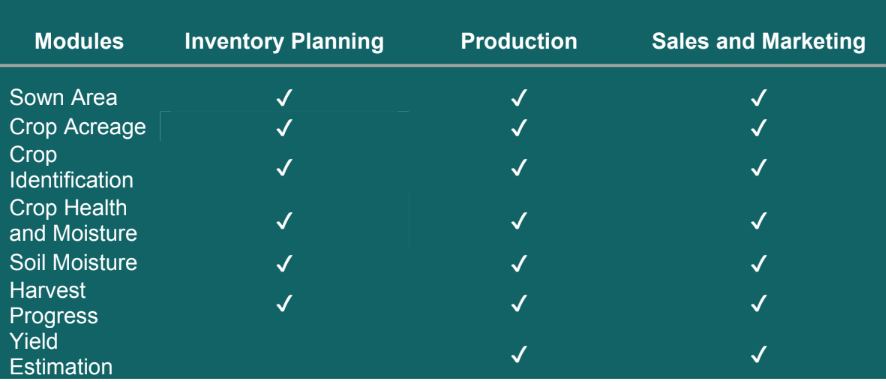
SatSure’s Geospatial Data for Fertiliser Companies
SatSure’s various data feeds can be used by several departments in fertiliser companies. The data is available via intuitive web dashboards and through API and bulk data interfaces.
For more details on how SatSure Sparta can help you build a digital process for resource allocation, sales, and operational planning, you can access datasets on https://sparta.satsure.co or reach out to us at info@satsure.co.
